Video MarketingLast updated August 5, 2026 · 8 min read
Watch Time Strategy: How to Turn One View Into a Longer Session in 2026
Watch time is still the metric that decides whether a video gets distributed, but in 2026 it works alongside retention, session contribution, and satisfaction. Here is how to raise all of them, starting with the first thirty seconds.
Watch time was the metric that changed YouTube's ranking system in 2012, and it is still the metric most creators obsess over. The more useful question for 2026 is how watch time works alongside the signals that surround it — retention, session contribution, and satisfaction — because the channels that grow are the ones that stop chasing a single number and start designing a viewing experience. This guide covers the benchmarks, the tools, and the strategies that turn one view into a longer session.
Why Watch Time Still Matters in 2026
In August 2012 YouTube announced it would rank and recommend videos on watch time rather than raw view count, a decision that reshaped the platform's entire incentive system. By 2026 watch time still matters, but it sits alongside viewer satisfaction and session contribution. Watch time is no longer the whole story; it is the entry requirement. A video that nobody finishes will not be recommended no matter how well packaged it is.
The 2026 algorithm guide covers how watch time interacts with the other ranking signals on each surface. Here we focus on the practical levers that raise watch time directly, the benchmarks that tell you whether you are winning, and the session design that turns a single view into a habit.
The Numbers Behind Watch Time
The arithmetic of watch time is simple and worth internalizing. 4,000 watch hours equals 240,000 watch minutes — the classic monetization threshold for the standard path. At a 4-minute average view duration, that is roughly 60,000 views. The illustration is arithmetic, not a target: most channels need more views than the math suggests because the real average view duration usually lands below four minutes, which pushes the required view count higher.
Metric
Value
Note
Monetization threshold
4,000 watch hours
Equals 240,000 watch minutes
Average view duration
4 minutes
Illustrative assumption
Views needed
~60,000
At a 4-minute average duration
Typical retention benchmark
50–60%
Solid for many niches
The takeaway is not the specific number of views. It is the relationship: longer average view duration means fewer views are needed to hit any watch time goal. Every percentage point of retention you recover compounds across the entire catalog, which is why retention work beats pumping out more uploads for most channels.
Retention Benchmarks That Actually Apply
Average view duration of around 50–60% of video length is a solid benchmark for many niches. Some professional guidance suggests 70% or higher triggers priority placement in suggested feeds, while anything below roughly 40% signals a hook, pacing, or promise problem. Treat these as guidance ranges, not guarantees — a forty-minute documentary and a four-minute tutorial behave very differently, and each niche has its own normal.
The reason percentages matter more than raw minutes is that they normalize for length. A short video can post excellent retention while a long one struggles to hold a third of its audience, and both numbers can be true for the same channel on the same day. Judge each video against its own format first, then against your channel's trend.
Retention benchmarks are ranges, not rules. Your niche, format, and audience determine what good looks like. Use these numbers to spot problems, not to declare victory or defeat after a single upload.
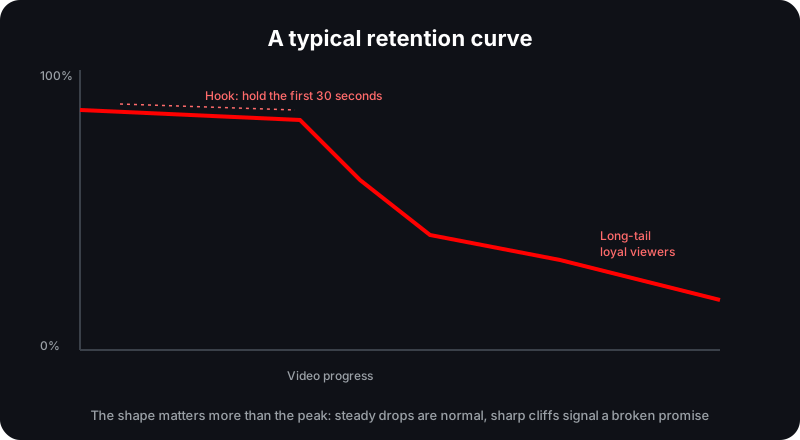
A typical retention curve: a strong first-thirty-second hook, gradual drop-off through the middle, and a loyal long tail that watches to the end.
The First 30 Seconds Decide Whether Most Viewers Stay
The first 30 seconds decide whether most viewers stay. A hook that delivers a specific promise early protects retention for the entire video, because viewers who know what is coming are willing to wait for it. The most common retention killer is a slow opening: a long logo intro, a re-explained premise, or thirty seconds of "hey guys" before the video actually starts.
Microhooks create open loops that pull viewers forward. A line like "in a minute you'll see why this matters" plants a question the viewer needs answered, and the need to close that loop is what carries them past the next decision point. Used honestly, microhooks are a pacing tool rather than clickbait.
Rewriting a weak hook
Weak: "In this video I'm going to talk about some stuff that helped my channel grow." Strong: "In one minute you'll see the exact graph that changed how I make every video." The second version names a concrete payoff, sets a deadline, and creates an open loop the viewer has to close. Everything that follows benefits from that early promise.
Read the Retention Graph Like a Pro
The retention graph in YouTube Studio shows exactly where viewers drop off, and the relative retention line benchmarks your video against similar videos on the platform. A sharp cliff in the first thirty seconds is a hook or packaging problem. A slow bleed through the middle is a pacing problem. A spike late in the video where you announced a coming section is a structural problem — viewers are waiting for the good part instead of enjoying the whole thing. Each pattern points to a different fix.
Combine the graph with the engagement rate calculator, which explains how views and likes combine into the engagement figure public tools report. Retention tells you whether the video held people; engagement tells you whether people acted. Both matter, but retention is where you intervene before an upload, while engagement is where you measure the result.
Turn One View Into a Session
Session contribution is the fastest-growing ranking signal: a video that leads into another video scores better than one that ends the session. The simplest way to earn it is a binge path — a recognizable format, a series structure, and a visual identity so one view naturally leads to the next. Playlists keep related videos queued, end screens and cards hand viewers to the next logical watch, and a series with a clear "part two" compels the click.
The comparison that matters most: a video with fewer views but strong retention and session value can outperform a higher-view video that viewers abandon quickly. Distribution rewards behavior, not the raw number. A channel where every video leads somewhere compounds across the catalog.
Your Watch Time Checklist
Write the hook before you write the script; the first 30 seconds are the whole funnel.
Deliver the specific promise from the title inside the first minute.
Use microhooks at every section break to create open loops.
Cut anything the retention graph shows viewers skipping.
Add end screens and playlists that continue the session on every video.
Publish on a consistent rhythm so repeat viewers build a habit.
Check relative retention against similar videos after each upload.
Use Public Data to Benchmark Watch Time
You cannot see another channel's private retention graph, but public data reveals the effects. Compare average views and engagement across a channel's recent uploads to spot where watch time is rising or stalling. The Creator Dashboard shows upload patterns and growth velocity, so you can see whether a format change actually moved the needle before you double down on it. Timing matters too — the best time to post guide covers the scheduling angle — but a good slot only helps a video that holds attention.
Turn views into sessions
Run your channel through the Creator Dashboard to see upload patterns, growth velocity, and engagement in one place.
The standard monetization threshold is 4,000 watch hours in a rolling 12-month window, which equals 240,000 watch minutes. At a 4-minute average view duration that is roughly 60,000 views, though most channels need more because the real average view duration is usually lower.
What is a good retention rate?
Average view duration of around 50–60% of video length is a solid benchmark for many niches. Some professional guidance suggests 70% or higher helps trigger priority placement in suggested feeds, and anything below roughly 40% signals a hook, pacing, or promise problem. These are guidance ranges, not guarantees.
Is session contribution more important than watch time?
Watch time still matters, but session contribution is the fastest-growing ranking signal. A video that leads into another watch via playlists, end screens, or a series scores better than one that ends the session.
How do I find where viewers drop off?
The retention graph in YouTube Studio shows exactly where viewers leave, and relative retention benchmarks your video against similar ones. The first 30 seconds decide whether most viewers stay, so that is where the hook matters most.
Sources and Methodology
This guide synthesizes YouTube's official documentation and public reporting. Figures that vary by audience, region, or advertiser demand are estimates, not guarantees.
 Norlytics